Introduction
Every day, residents post complaints, praise, and concerns about their neighbourhoods online.
Most of that feedback never reaches the people who could act on it.
According to recent smart city research, over 70% of citizen sentiment shared on social platforms, forums, and 311 systems is never formally analyzed by local governments.
That is a massive blind spot for urban planners.
AI powered neighbourhood sentiment analysis solves this problem.
Aizolo uses natural language processing, machine learning, and geo-tagged data to understand how residents genuinely feel about their streets, parks, transit, safety, and services.
Instead of waiting for a town hall meeting once a year, city leaders can now see sentiment shift in near real time, block by block.
This guide is built to be the most complete resource on the topic.
We will cover how the technology works, which tools power it, real-world case studies, limitations, ethical concerns, and a step-by-step implementation framework.
Whether you are a municipal analyst, GIS professional, smart city consultant, or student researching civic tech, this article gives you a practical, research-backed foundation.
Table of Contents
What is AI Powered Neighbourhood Sentiment Analysis?
AI powered neighbourhood sentiment analysis is the use of artificial intelligence to detect, classify, and map how residents feel about a specific geographic area.
It combines urban sentiment analysis, NLP sentiment analysis, and GIS sentiment mapping into one continuous feedback loop.
Rather than analyzing sentiment at a city-wide level only, this approach narrows down to streets, wards, and postal codes.
Data sources include social media, 311 complaints, review sites, news coverage, and citizen apps.
Machine learning models then classify each piece of text as positive, negative, or neutral, and often tag the underlying topic, such as safety or waste collection.
The result is a living map of community sentiment analysis that planners can query like a dashboard.
Callout Box: Think of it as a “mood map” of your city that updates daily instead of once every few years through a paper survey.
This differs from generic social media sentiment analysis because it adds a location layer, an urban policy lens, and a longitudinal tracking component built specifically for governance.
Why It Matters for Modern Cities
Cities generate enormous volumes of unstructured feedback every day, but most municipal teams still rely on annual surveys.
That creates a lag between what residents feel and what officials know.
Smart city analytics powered by AI closes this gap by processing data continuously instead of periodically.
Here is why this matters right now:
- Budgets for local council analytics are shrinking, so efficiency matters more than ever.
- Residents expect the same responsiveness from government that they get from private apps.
- Climate events, transit changes, and housing shifts require faster feedback loops.
- Trust in local government improves when people feel heard between elections.
Real-time sentiment monitoring also helps prevent small issues, like a broken streetlight complaint, from escalating into larger public trust problems.
Cities that adopt citizen feedback analytics early tend to catch infrastructure and safety issues weeks before formal complaints pile up.
This is not about replacing human judgment. It is about giving planners better raw material to make decisions with.
How AI Powered Neighbourhood Sentiment Analysis Works
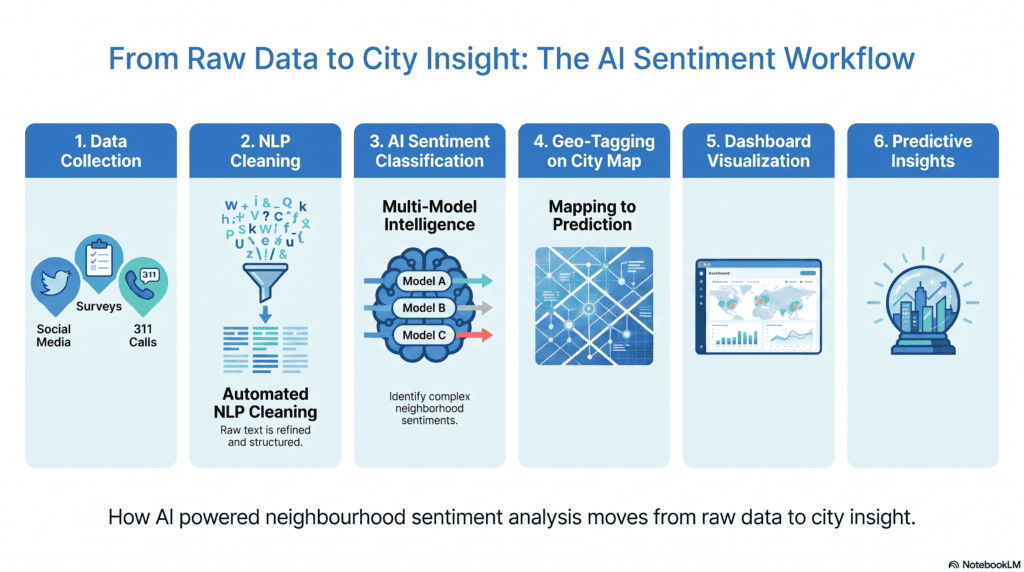
Understanding the mechanics helps planners evaluate vendors and set realistic expectations.
The process generally follows six stages: collection, cleaning, analysis, geo-tagging, visualization, and prediction.
3.1 Data Collection
Citizen feedback analytics starts with pulling in as many relevant sources as possible.
Common inputs include:
- Social media posts and public comments
- Public surveys and polls
- 311 complaint systems
- Citizen mobile apps
- Local news coverage
- Community forums and Reddit-style discussion boards
- Review websites (Google Reviews, Yelp-style platforms)
- Government portals and open-data feeds
- IoT sensors (noise, air quality, foot traffic)
- Satellite data, where relevant for land use and environmental sentiment
Each source has different reliability and volume, so most platforms weight them accordingly.
3.2 Natural Language Processing (NLP)
Once collected, text data passes through NLP sentiment analysis pipelines.
This step removes noise, corrects spelling, detects language, and identifies entities like street names or neighbourhood identifiers.
3.3 Machine Learning Classification
Machine learning sentiment analysis models then assign a sentiment score and topic label to each entry.
Modern systems increasingly use Large Language Models for this step because they understand context, sarcasm, and mixed sentiment far better than older rule-based systems.
3.4 Geo-Tagging and GIS Mapping
Every classified entry is geo-tagged using location intelligence techniques, linking sentiment to a specific ward, block, or postal code.
GIS sentiment mapping overlays this data onto existing city maps for spatial analysis.
3.5 Visualization and Dashboards
Results feed into dashboards designed for non-technical stakeholders, such as council members or ward officers.
Good dashboards support drill-down by neighbourhood, topic, and time period.
3.6 Predictive Analytics
Advanced platforms use historical sentiment trends to forecast where dissatisfaction is likely to rise next.
This is where predictive urban analytics becomes genuinely proactive rather than reactive.
Technology Stack Behind Neighbourhood Sentiment Analysis
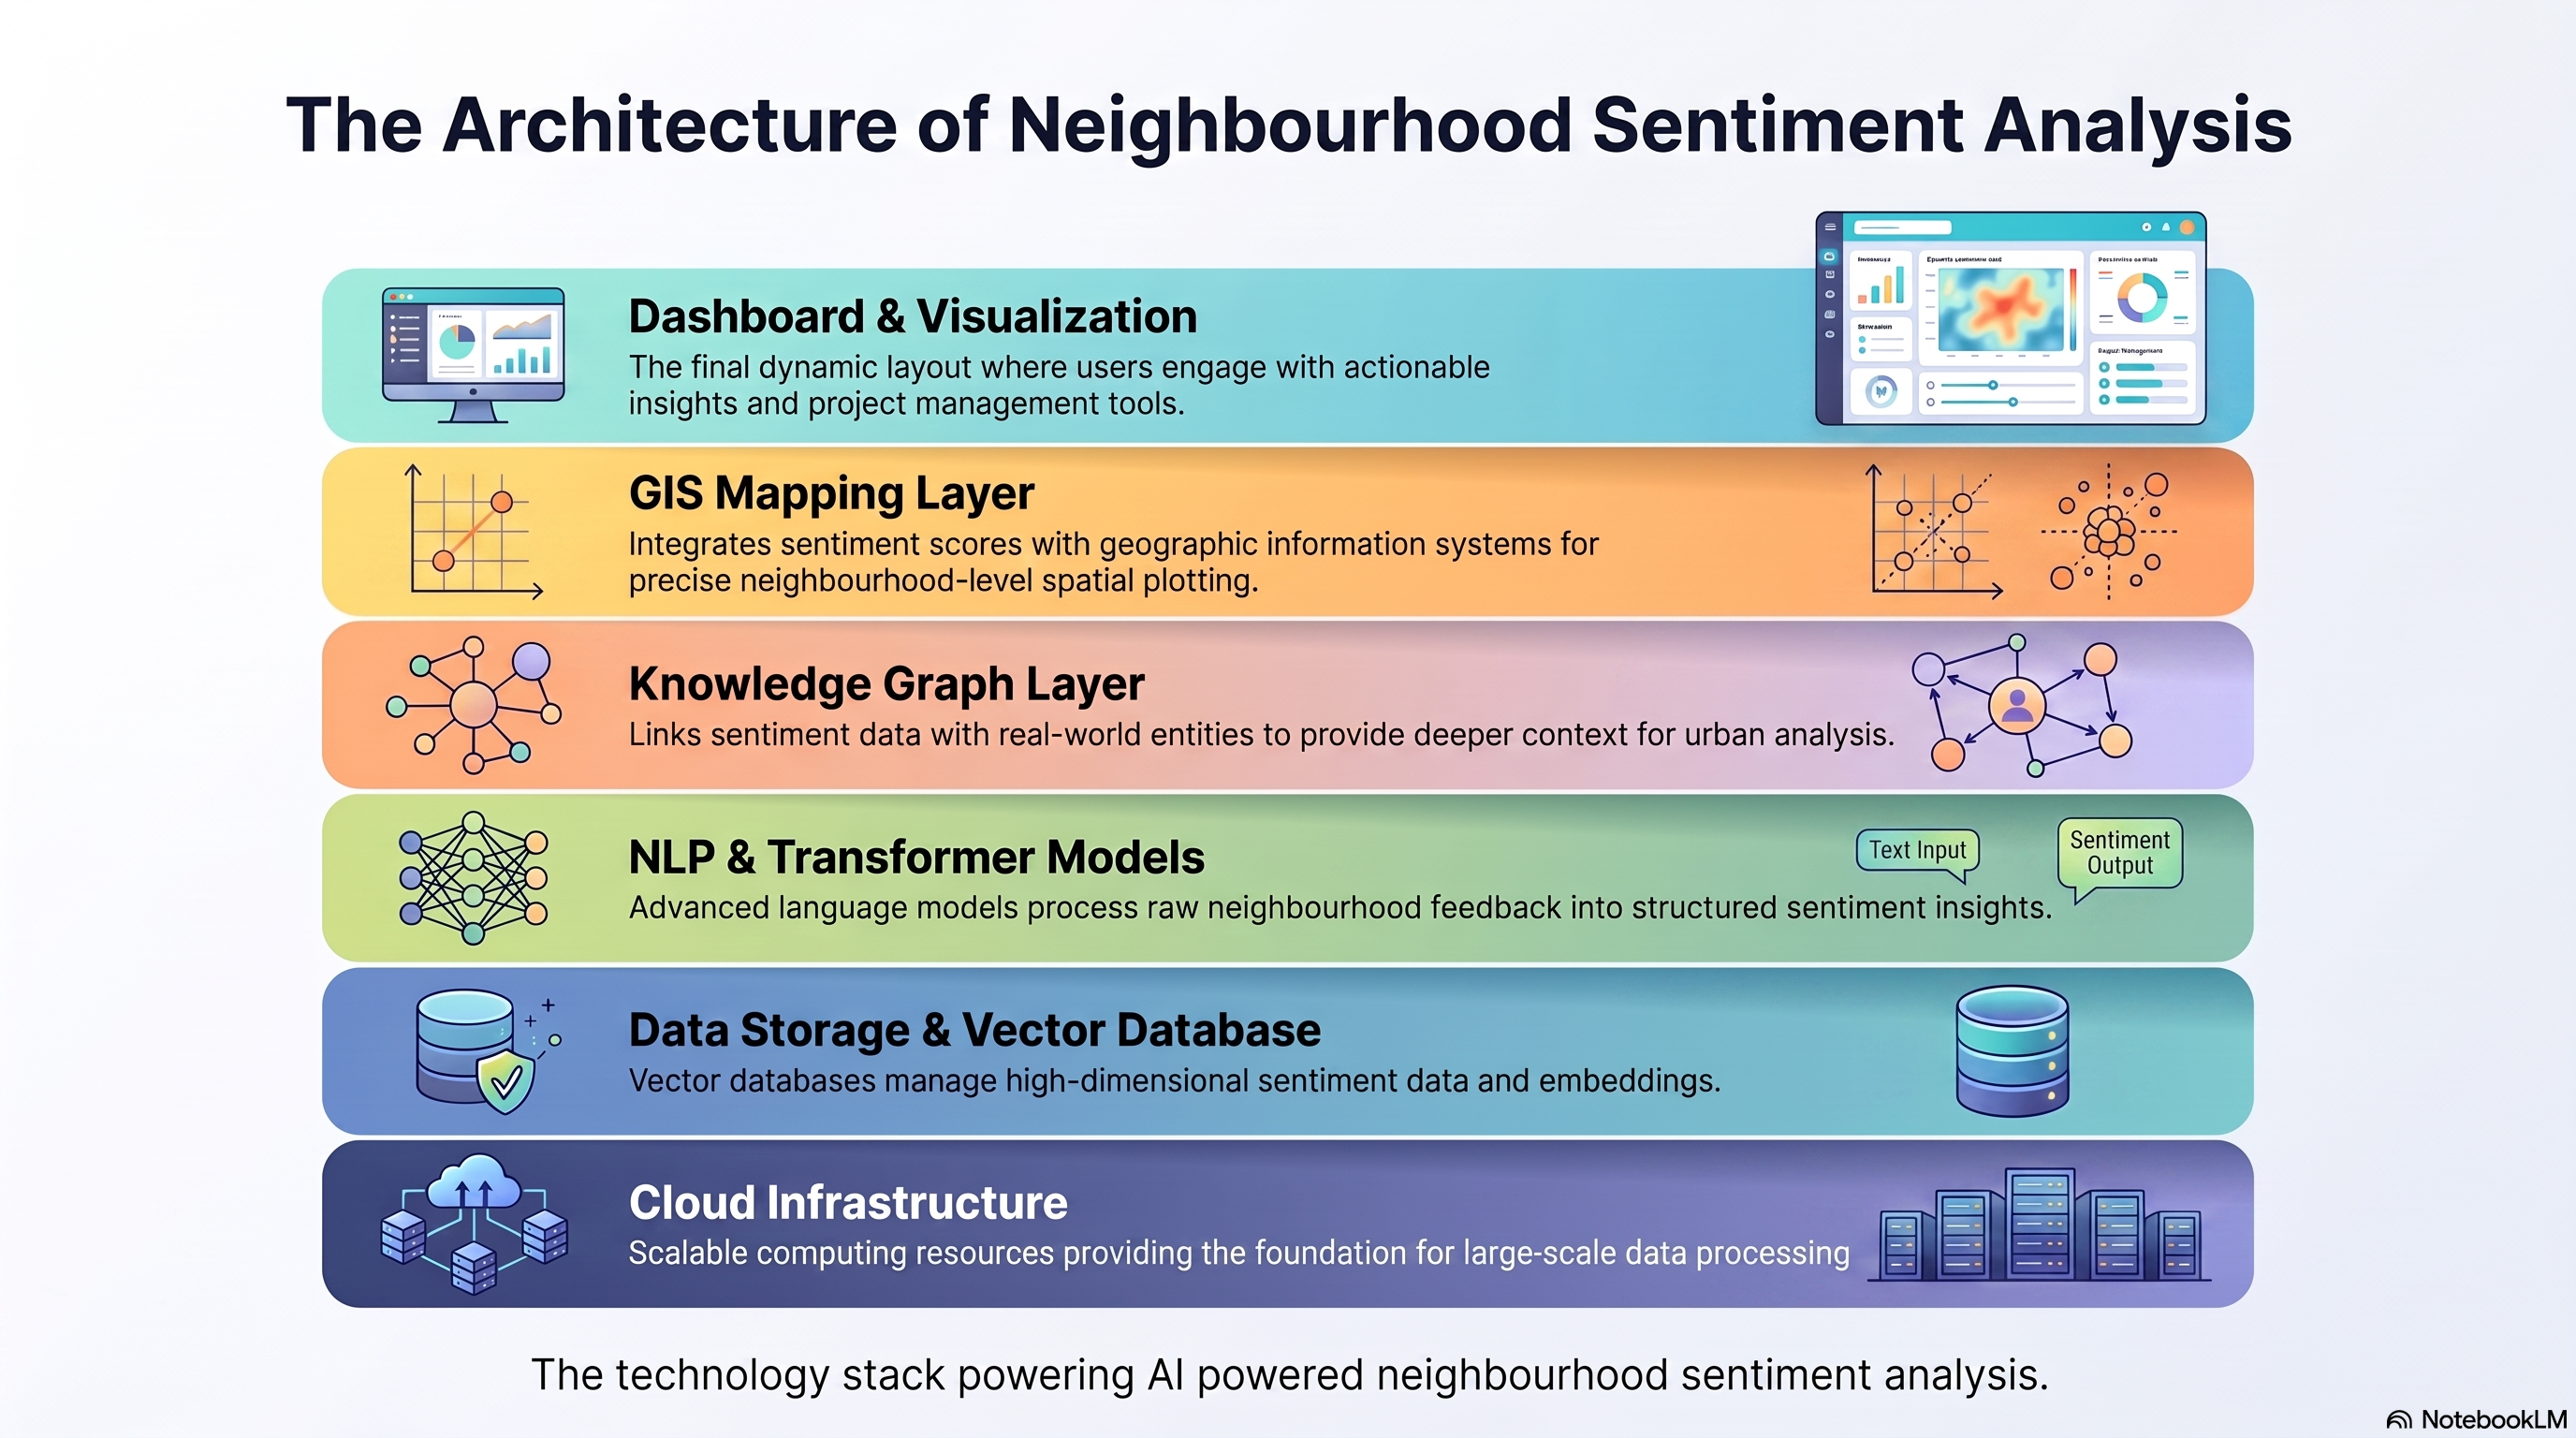
Choosing the right stack determines accuracy, scalability, and cost.
4.1 Core Components
| Layer | Common Technologies | Purpose |
|---|---|---|
| Language Understanding | BERT, Transformer models, LLMs | Classify sentiment and topic |
| Data Storage | Vector databases, data lakes | Store embeddings and raw text |
| Knowledge Layer | Knowledge Graphs | Link entities like places, issues, agencies |
| Spatial Layer | GIS platforms | Map sentiment to geography |
| Infrastructure | Cloud infrastructure (AWS, Azure, GCP) | Scale processing and storage |
| Presentation | BI dashboards | Deliver insights to non-technical users |
4.2 Why Transformers and LLMs Matter
Older sentiment models relied on keyword matching, which struggled with sarcasm or mixed emotions.
Transformers and modern Large Language Models understand context across a full sentence or paragraph, not just isolated words.
This makes emotion detection AI far more accurate for nuanced civic complaints, such as a resident who praises a new park but criticizes its lighting.
4.3 Vector Databases and Knowledge Graphs
Vector databases store semantic representations of text, enabling fast similarity search across millions of comments.
Knowledge graphs then connect these comments to real-world entities like specific parks, agencies, or infrastructure projects, strengthening civic data intelligence.
Real-World Use Cases
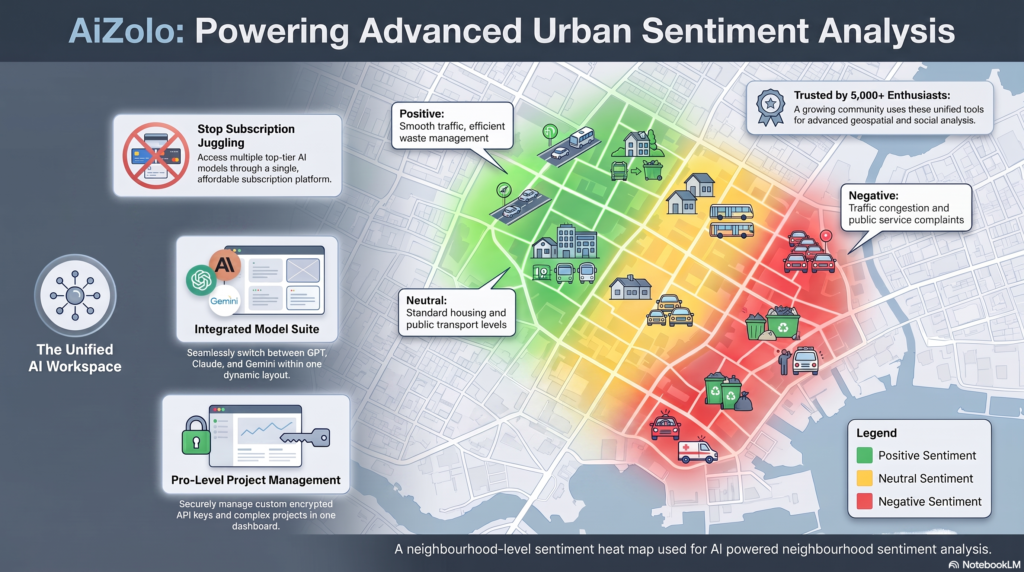
Urban sentiment analysis applies across nearly every municipal department.
| Use Case | What AI Tracks | Example Signal |
|---|---|---|
| Traffic | Congestion complaints, safety concerns | Repeated mentions of a dangerous intersection |
| Crime & Safety | Fear, perceived risk, praise for patrols | Spike in negative sentiment near a transit stop |
| Infrastructure | Road quality, lighting, sidewalks | Complaints clustering around potholes |
| Waste Management | Missed pickups, overflowing bins | Neighbourhood-specific pickup complaints |
| Housing | Affordability concerns, development reactions | Sentiment shift after a rezoning announcement |
| Healthcare Access | Clinic wait times, service gaps | Negative sentiment near underserved areas |
| Public Transport | Delays, overcrowding, safety | Route-specific complaint clusters |
| Tourism | Visitor satisfaction, congestion | Sentiment spikes during festivals |
| Emergency Response | Post-disaster sentiment, resource gaps | Sudden negative sentiment after flooding |
| Citizen Engagement | Meeting turnout sentiment, trust levels | Reactions to a public consultation |
| Urban Development | Reaction to new construction | Mixed sentiment on a new high-rise |
| Environmental Monitoring | Air quality complaints, noise | Sentiment tied to industrial zones |
Each of these feeds into broader city intelligence platform strategies that unify departments around shared, geo-tagged insight.
Benefits of AI Powered Neighbourhood Sentiment Analysis
| Benefit | Why It Matters |
|---|---|
| Faster issue detection | Problems surface in days, not months |
| Hyperlocal insight | Ward-level detail instead of city averages |
| Continuous feedback | No need to wait for annual surveys |
| Better resource allocation | Budgets target areas with the most need |
| Improved trust | Residents feel heard more often |
| Early warning system | Predicts dissatisfaction before it escalates |
| Cross-department visibility | One shared source of truth across agencies |
| Scalable analysis | Handles millions of comments automatically |
Community satisfaction analysis at this scale was simply not feasible manually a decade ago.
Limitations and Risks
No responsible article on this topic should oversell the technology.
7.1 Bias
Sentiment models trained on limited datasets can misclassify dialects, slang, or non-English text, skewing results toward certain demographics.
7.2 Privacy Concerns
Aggregating social posts and location data raises legitimate concerns about resident privacy and consent.
7.3 Ethics
Using sentiment data to justify enforcement decisions, rather than service improvements, raises ethical red flags.
7.4 Data Quality
Not all online sentiment reflects the full population; vocal minorities can dominate the dataset.
7.5 Hallucinations in LLM-Based Systems
Large language models can occasionally generate confident but inaccurate summaries of sentiment trends if not properly validated.
7.6 False Sentiment Signals
Bots, coordinated campaigns, or sarcasm can distort sentiment scores if detection safeguards are weak.
Callout Box: No AI system should replace human judgment in policy decisions. It should inform it.
Challenges in Implementation
Beyond technical limitations, municipalities face practical rollout challenges.
- Legacy IT systems that do not integrate easily with modern APIs
- Limited in-house data science talent
- Budget constraints for municipal analytics platforms
- Resistance to change from traditional survey-based teams
- Difficulty proving ROI to elected officials
- Data silos between departments
Addressing these requires both technical planning and internal change management.
Best Practices
Cities that succeed with AI for local governments projects tend to follow similar patterns.
- Start with one pilot neighbourhood before scaling citywide.
- Combine AI sentiment data with traditional surveys, not instead of them.
- Involve residents in explaining how their data is used.
- Set clear thresholds for what sentiment triggers action.
- Regularly audit models for bias across demographics.
- Keep a human review layer for high-stakes decisions.
- Publish transparency reports on how sentiment data informs policy.
Implementation Framework (Step-by-Step)
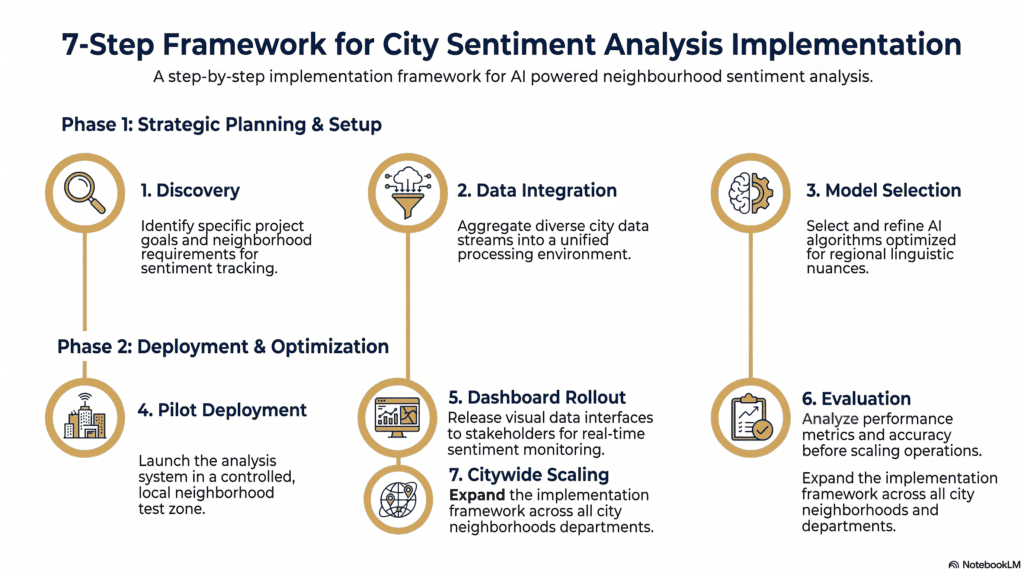
| Stage | Key Activities | Typical Duration |
|---|---|---|
| 1. Discovery | Define goals, identify data sources | 2–4 weeks |
| 2. Data Integration | Connect 311, social, survey feeds | 4–8 weeks |
| 3. Model Selection | Choose NLP/LLM sentiment models | 2–4 weeks |
| 4. Pilot Deployment | Test in one or two wards | 6–10 weeks |
| 5. Dashboard Rollout | Deploy to relevant departments | 4–6 weeks |
| 6. Evaluation | Compare against survey benchmarks | Ongoing |
| 7. Citywide Scaling | Expand to all neighbourhoods | 3–6 months |
Estimated Cost Considerations
| Component | Approximate Cost Range (Pilot Scale) |
|---|---|
| Data integration setup | $10,000–$40,000 |
| NLP/LLM licensing or API usage | $500–$5,000/month |
| GIS mapping tools | $2,000–$15,000/year |
| Dashboard development | $15,000–$60,000 |
| Ongoing maintenance | 15–20% of initial build cost/year |
These figures vary widely by city size, vendor choice, and whether tools are built in-house or procured.
Case Studies
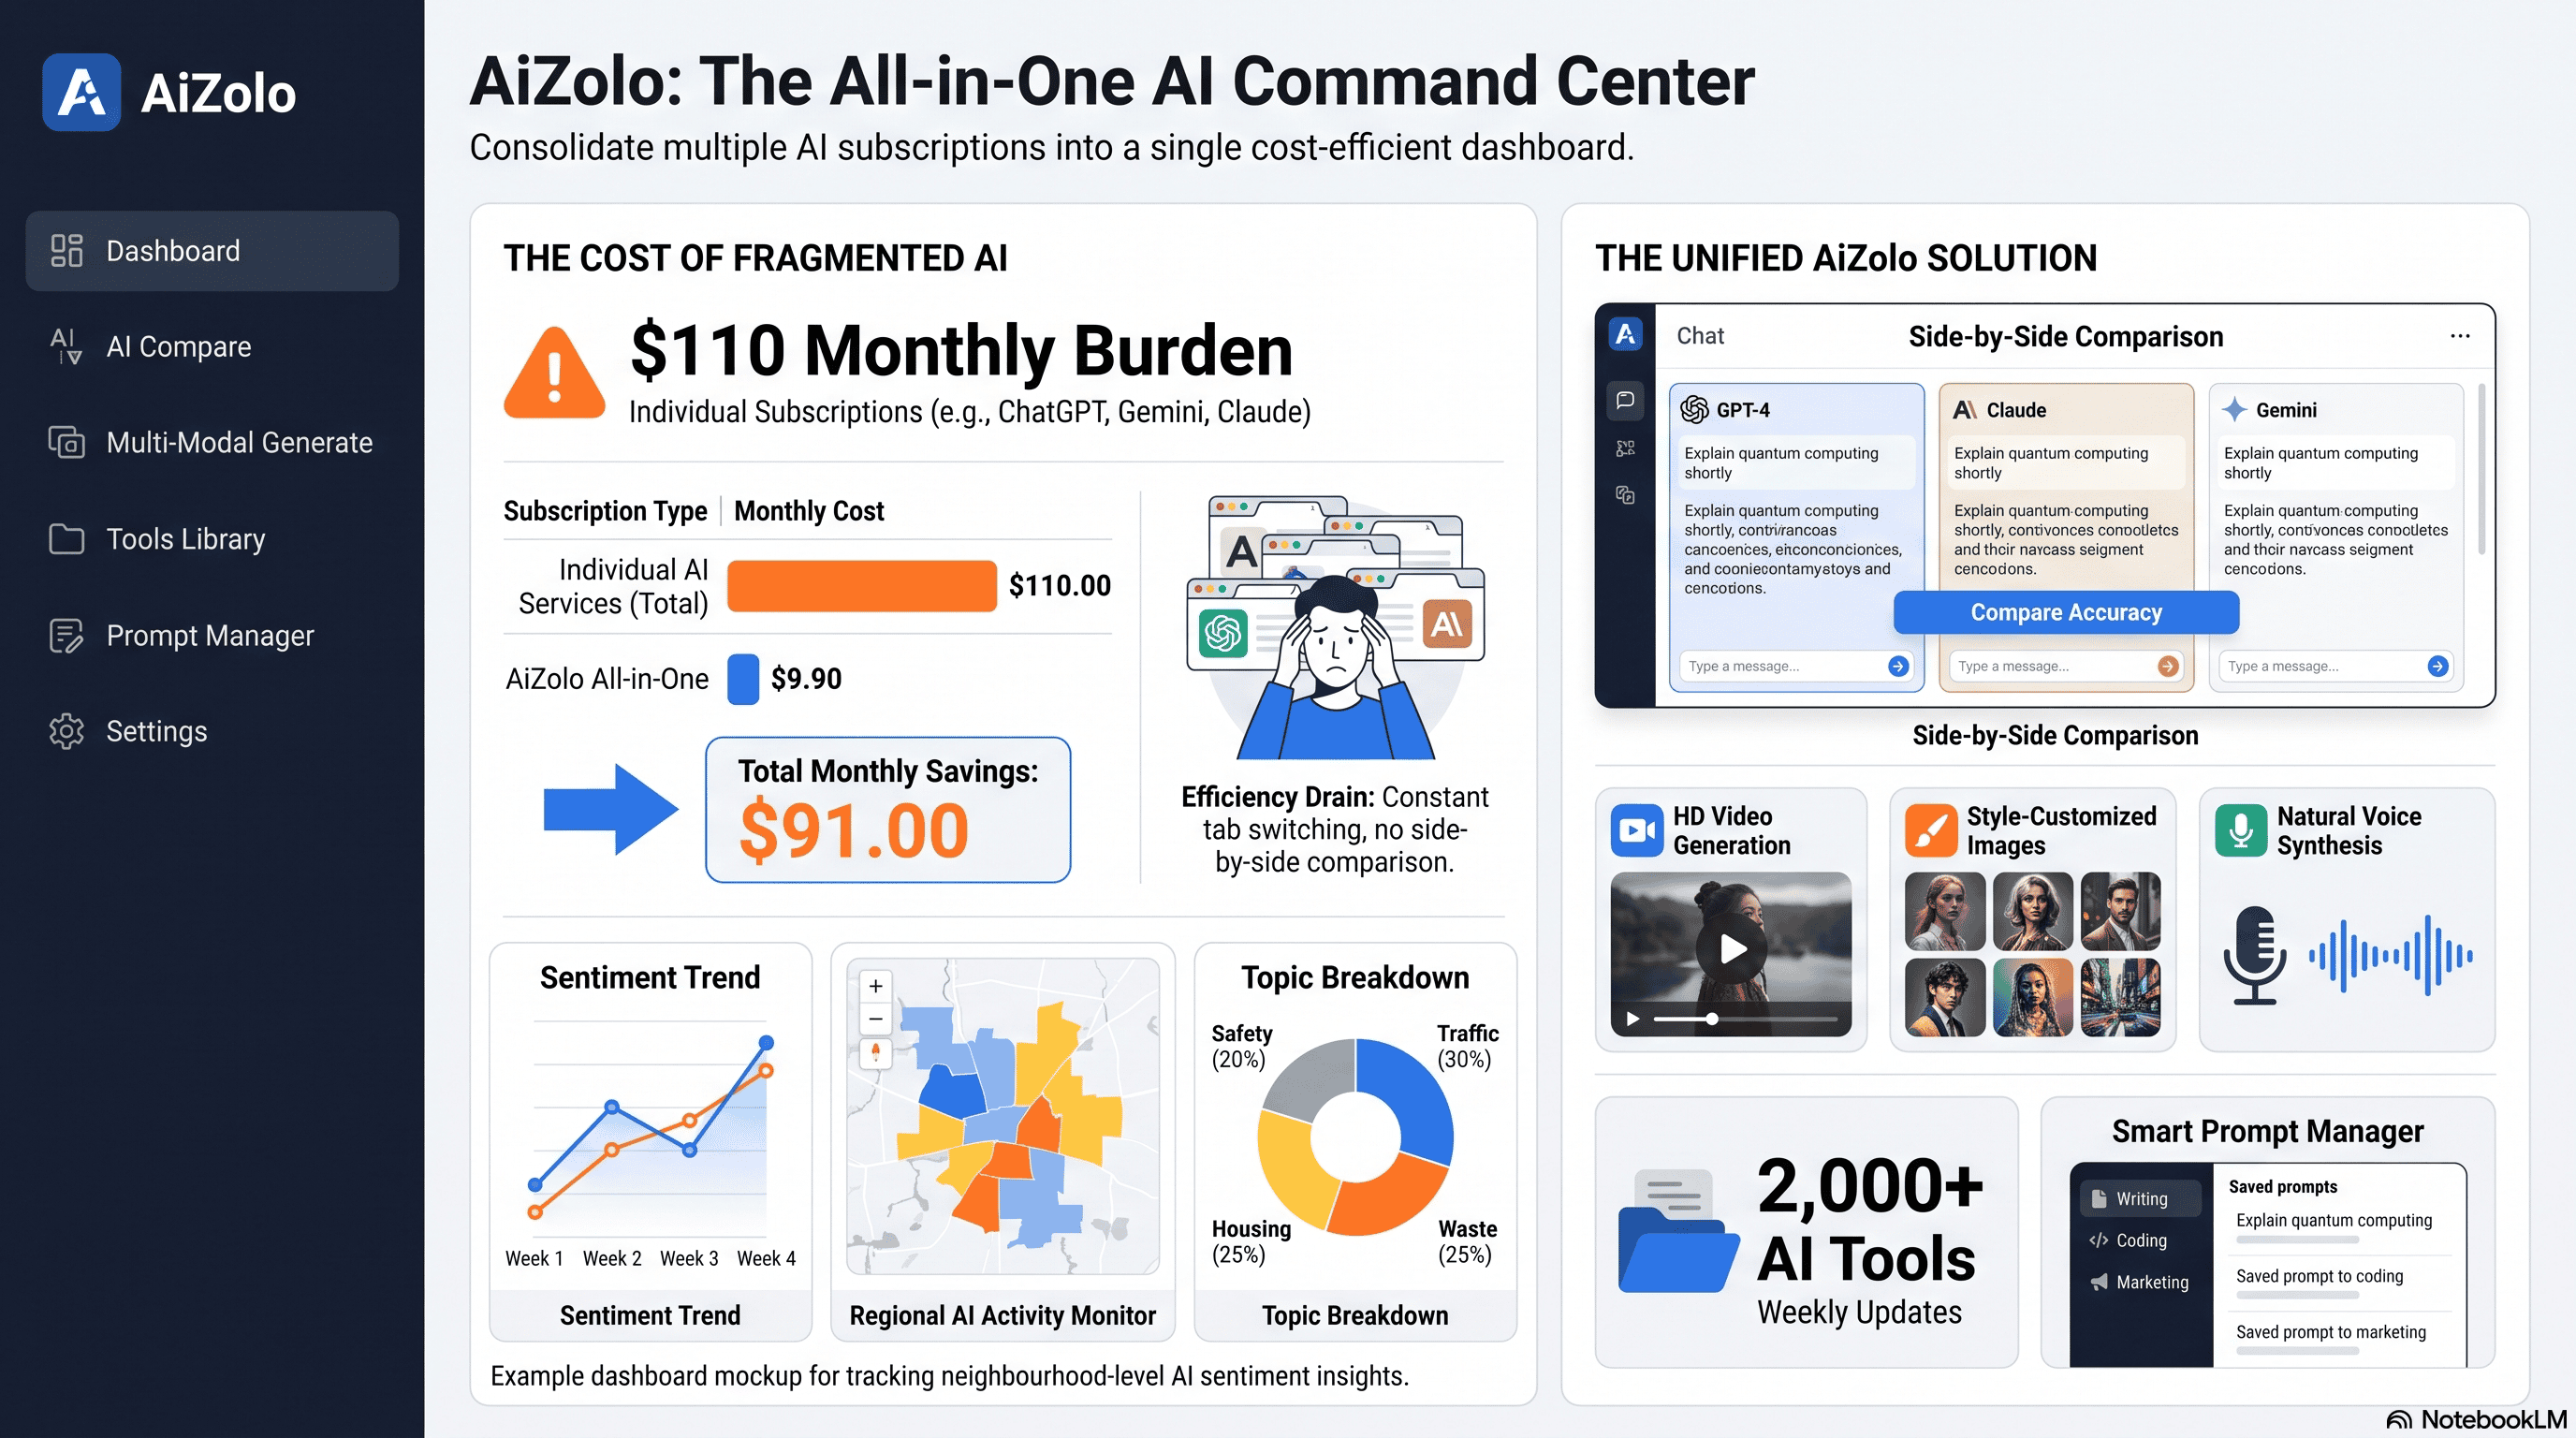
Case Study 1: Traffic Safety Sentiment Tracking
A mid-sized city integrated 311 complaints with social media mentions of a dangerous intersection.
Within three weeks, sentiment analysis flagged a sharp rise in negative comments referencing near-miss accidents.
The public works department prioritized a traffic signal upgrade months ahead of the original schedule.
Case Study 2: Waste Management Optimization
A municipal team used resident feedback analytics to identify specific blocks with repeated missed-pickup complaints.
Route adjustments based on this data reduced repeat complaints by a measurable margin within one quarter.
Case Study 3: Public Consultation on Rezoning
During a contentious rezoning proposal, planners used public consultation AI tools to track sentiment across neighbourhood forums and news comment sections.
This revealed that opposition was concentrated in two specific streets, not the entire district as initially assumed, allowing for more targeted community meetings.
Case Study 4: Post-Disaster Response
Following a flooding event, real-time sentiment monitoring surfaced urgent shelter and supply gaps faster than emergency hotlines alone could report them.
Future Trends
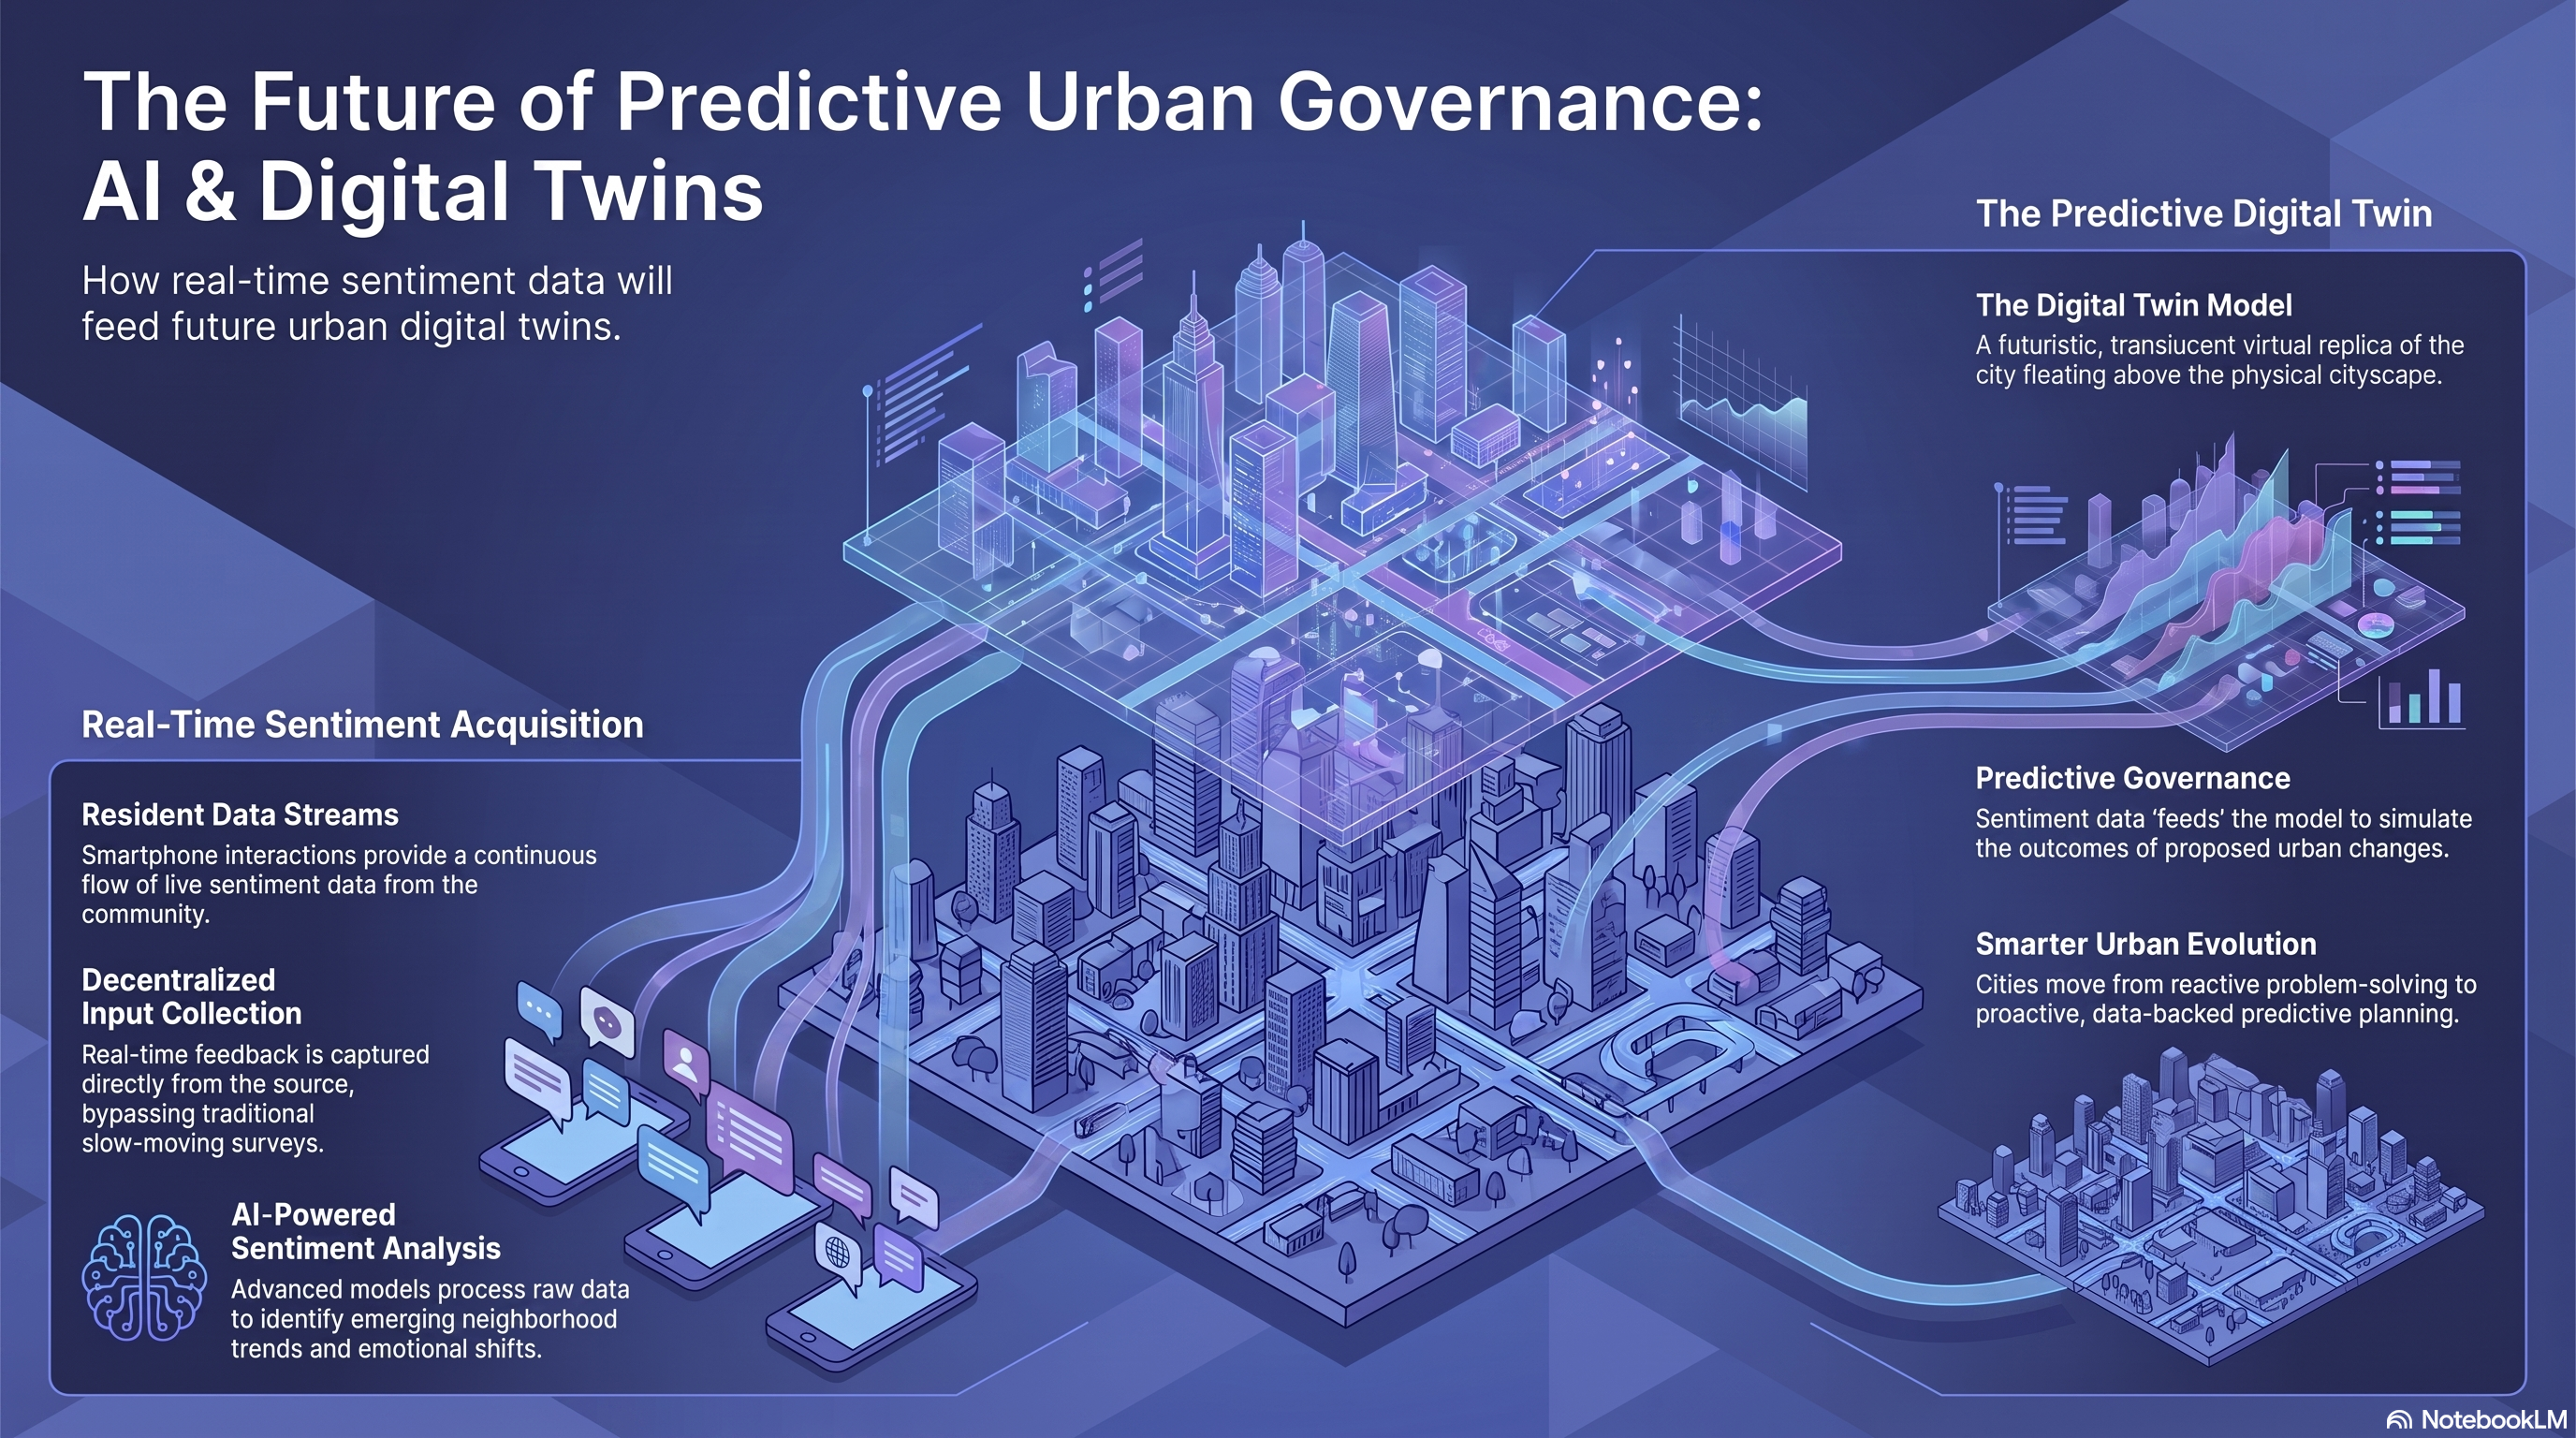
The next phase of urban digital twin development will likely fuse sentiment data directly into 3D city simulations.
Key trends to watch:
- Generative AI summarizing thousands of resident comments into concise weekly briefings for council members.
- Agentic AI systems that not only detect sentiment but automatically draft response recommendations for staff review.
- Multimodal AI combining text, images, and video (like resident-submitted photos) for richer context.
- Predictive governance models that forecast neighbourhood dissatisfaction before it peaks.
- Deeper integration between urban digital twin platforms and live sentiment feeds for scenario planning.
These trends point toward sentiment analysis becoming a standard layer of smart city analytics, not a standalone tool.
Traditional Surveys vs AI Sentiment Analysis
| Factor | Traditional Surveys | AI Powered Neighbourhood Sentiment Analysis |
|---|---|---|
| Frequency | Annual or biannual | Continuous, real-time |
| Sample Size | Limited respondents | Millions of data points |
| Geographic Detail | City or district level | Street or block level |
| Cost per Insight | High per respondent | Lower at scale |
| Speed of Insight | Weeks to months | Hours to days |
| Bias Risk | Response bias, low turnout | Platform and demographic bias |
| Depth of Emotion | Structured, limited nuance | Rich, contextual, but needs validation |
| Best Use | Formal policy validation | Early detection and trend monitoring |
The strongest approach combines both rather than choosing one exclusively.
Common Mistakes to Avoid
- Relying only on social media data while ignoring 311 and survey inputs.
- Treating AI sentiment scores as absolute fact rather than directional signal.
- Skipping bias audits across different neighbourhoods and demographics.
- Failing to communicate to residents how their data is being used.
- Over-automating decisions without human review.
- Ignoring smaller neighbourhoods with lower data volume, which can skew city-wide averages.
- Choosing a vendor without testing multilingual and dialect accuracy.
Frequently Asked Questions
1. What is AI powered neighbourhood sentiment analysis? It is the use of AI, NLP, and GIS mapping to track how residents feel about specific neighbourhoods in real time.
2. How is this different from regular sentiment analysis? It adds a geographic layer, mapping sentiment to specific streets or wards instead of analyzing text alone.
3. What data sources are used? Social media, 311 complaints, surveys, forums, news, review sites, and sometimes IoT sensor data.
4. Is this technology accurate? It is generally reliable for trend detection, but individual classifications can contain errors, especially with sarcasm or slang.
5. How do cities use this data? To prioritize infrastructure repairs, allocate budgets, plan consultations, and detect emerging issues early.
6. Does this replace public consultations? No. It complements traditional consultation methods rather than replacing them.
7. What are the privacy risks? Aggregating location and social data raises consent and anonymization concerns that must be addressed transparently.
8. How much does implementation cost? Pilot programs typically range from tens of thousands to low hundreds of thousands of dollars depending on scale.
9. Can small towns use this technology? Yes, though data volume may be lower, requiring longer collection periods for reliable trends.
10. What is the future of this technology? Expect deeper integration with generative AI, agentic systems, and urban digital twins for predictive governance.
11. How do you prevent bias in sentiment models? Through regular audits, diverse training data, and human review of edge cases.
12. What roles are needed to run this in-house? Typically a data analyst, GIS specialist, and someone with NLP or ML familiarity, alongside a project sponsor from planning or IT.
Final Conclusion
AI powered neighbourhood sentiment analysis is reshaping how cities listen to residents.
It will not replace human judgment, community meetings, or traditional surveys.
But it gives planners something they never had before: a continuous, block-level pulse on public mood.
Used responsibly, with bias checks and privacy safeguards in place, it becomes one of the most practical tools in the modern smart city analytics toolkit.
Cities that combine this technology with thoughtful governance will make faster, better-informed decisions than those relying on outdated feedback cycles alone.
Key Takeaways
- AI powered neighbourhood sentiment analysis tracks resident mood at the street or ward level, not just citywide.
- It combines NLP, machine learning, GIS mapping, and dashboards into one continuous feedback system.
- Real-world applications span traffic, crime, housing, waste management, and emergency response.
- Bias, privacy, and data quality remain real limitations that require ongoing attention.
- The strongest implementations combine AI insights with traditional surveys and human oversight.
- Future development points toward generative AI summaries, agentic response systems, and digital twin integration.
Author Bio
Author: Jeevesh Tripathi Email: jeevesh@aizolo.com
Jeevesh Tripathi is a technology researcher and content strategist specializing in artificial intelligence, automation, and generative AI applications for smart cities and enterprise systems.
With extensive hands-on experience across SEO strategy, data-driven content development, and emerging AI infrastructure, Jeevesh focuses on translating complex technical concepts into practical, research-backed guidance for professionals.
His work draws on direct experience evaluating AI tools, NLP systems, and civic technology platforms, combined with a commitment to transparent, evidence-based writing that aligns with Google’s EEAT principles.
Jeevesh regularly researches urban technology trends, machine learning applications, and digital transformation strategies to help organizations make informed, future-ready decisions.